Generate reports and sheets
Using the Report sheets button, the user can generate sheets, report and charts for the calculated location again. Sheets are always generated in accordance with the result configuration.
Report Options Dialog
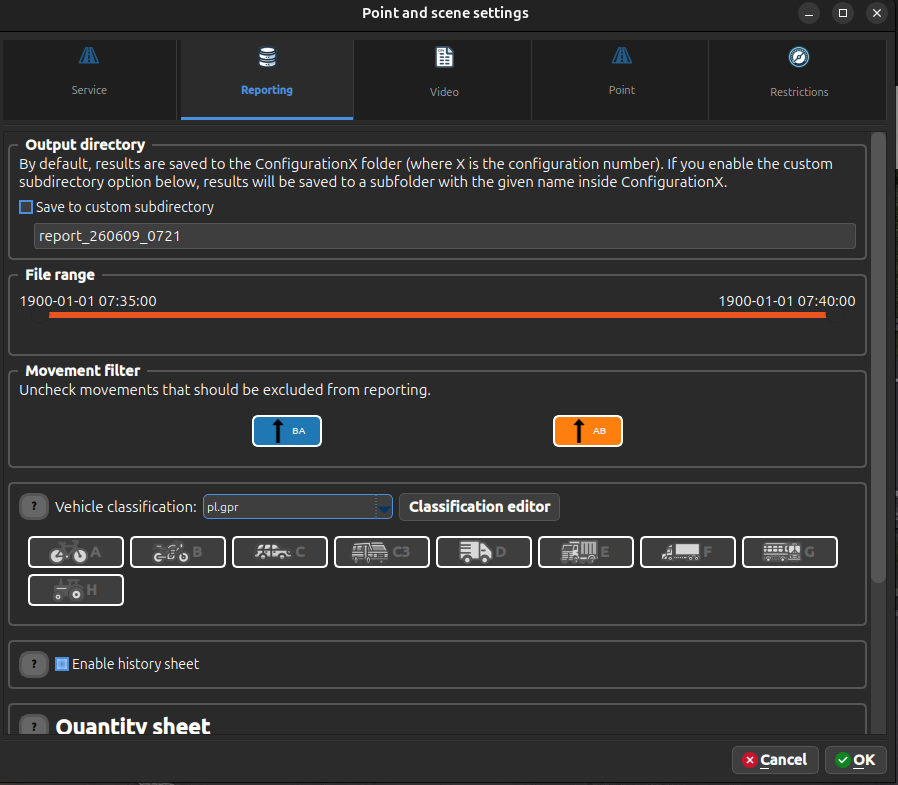
When you click the "Report sheets" button, a dialog appears allowing you to configure all reporting options before generating the report. This dialog provides centralized control over what data is included and how it is formatted.
Report time range
The dialog includes a time-range slider with five-minute steps:
- Use the left handle to set the start of the range.
- Use the right handle to set the end of the range.
- Events in that time interval are included regardless of recording-file boundaries.
The filter uses the source timeline before the optional Reported Measurement Time shift is applied. The slider selects the range in five-minute increments, while Quantity Grouping sets the result aggregation period.
Movement Filter
The dialog also includes a Movement filter. Uncheck any movement that should not be included in generated reports.
- The history, speed, ALPR, CO2 and other history-based report sections exclude trackers that contain an unchecked movement.
- Quantity sheets split multi-movement tracker rows first, so the checked movement can still be counted while unchecked movements are omitted.
- Leaving all movements checked is the same as using no movement filter.
Available Options
The Report Options dialog allows you to configure:
| Option | Description |
|---|---|
| Vehicle Classification | Choose the classification method (GPR, Euro-6, SCPR, etc.) |
| History Sheet | Enable/disable generation of full tracker history |
| Movement Filter | Include or exclude selected traffic movements from generated reports |
| Reported Measurement Time | Optionally set the report start time from which timestamps begin only in generated reports |
| Quantity Grouping | Set the time period for grouping results (5 minutes by default; 10, 15, 20, 30, 60, or 120 minutes) |
| Main Category | Select the primary category for quantity sheets |
| Sheet Layout | Choose between different output formats |
| Velocity Sheet | Enable/disable speed measurement results |
| ALPR Sheet | Enable/disable license plate recognition results |
After clicking OK, all settings are saved to the configuration and the report generation begins with the selected options.
Time grouping also works for recordings without recognized filename dates and for recordings shorter than one grouping period. A valid event always keeps its interval. Recording-file boundaries do not split time groups: recordings contributing to the same interval are summed into one bucket.
The configured report start time (Reported Measurement Time) shifts result, location, and file timestamps by the
same amount in generated reports. It does not modify source data or the canonical time shown during
playback, in file lists, or in tracker views. The report range slider also stays on the canonical
source axis: it selects data first, and only then are disposable export copies shifted. Without an
configured report start time, reports use canonical time, so undated results can remain on the 1900-01-01 timeline.
Output Types - History
History.csv- a sheet with the entire history of all objects (correct and incorrect) and all parameters determined for each tracker. Each passage occupies one row. A tracker counted in multiple movements is split into subrecords linked byTUID, withsubtuidnumbered from 0.
The is_counted column states whether the row contributes to quantity reports. validation_reason contains the stable validation status code:
Validated |
validation_reason |
is_counted |
|---|---|---|
| 0 | Unknown |
false |
| 1 | Validated |
true |
| 2 | AreaUncounted |
false |
| 3 | RelationUncounted |
false |
| 4 | CrosssectionUncounted |
false |
| 5 | Cargo |
false |
| 6 | LabelUncounted |
false |
| 7 | ValidatedMerged |
true |
| 8 | MultiValidated |
true |
| 9 | MergedUncounted |
false |
| 255 | Invalid |
false |
Types of output data - Quantity
Quantity.csv/xlsx- a sheet containing quantity-counting results. See Quantity sheet layouts.*.png- quantitative charts, including daily category and movement shares, their hourly changes, and a daily profile with PHF calculated every 15 minutes from canonical five-minute data,Report.docx- the quantity report includes observed or estimated daily traffic and peak hours. Its peak table also contains PHF; values closer to 1 indicate a more even vehicle flow across the four quarters of an hour.
Analytical scopes in the report
Main cartograms, structures, the daily profile, PHF, and peak hours contain only road vehicles on
Road movements. Road micromobility is presented separately. Crosswalk participants are counted
only on Crosswalks movements, with separate pedestrian, bicycle, personal transport device, and
scooter values plus their total.
Traffic-forecast profiles separate workdays from weekends. Workdays have morning and afternoon profiles. The weekend uses an explicitly configured single-daytime mode or morning-and-afternoon mode. Each profile includes a directional structure and a vehicle-category structure for every direction according to the active classification.
The report distinguishes a count observed during the measurement period, traffic observed over one complete day, an average of several complete observed days, and a daily estimate based on a complete 16-hour method. A result is not called annual average daily traffic without an explicit annual method and all required inputs. At a junction, the sum of passages is not automatically presented as the daily traffic of one road cross-section.
When the measurement duration does not support a daily result, the report shows the number of
vehicles observed over the exact measurement period. It does not present an artificial ADT = 0 or
per-movement and crossing ADT lists.
The report begins with one compact line containing the measurement date, hours, and duration. For
time-only material, the technical 1900-01-01 value is omitted. It then presents icon-labelled totals
for vehicles, pedestrians, and cyclists. A separate table compares light and heavy vehicles by count
and percentage; another shows buses and minibuses with their share of road traffic. Minibuses remain
part of the light-vehicle group, so the two views must not be added together. These values come from
raw AI classes and the relevant movement types, independently of the sheet classification.
The daily traffic chart highlights the busiest 60 minutes in three parts of the day: morning peak
(06:00–10:00), midday peak (10:00–15:00), and afternoon peak (15:00–19:00). Each hour is selected as
the busiest four consecutive, complete 15-minute intervals within its search window. Every 15-minute
bar contains traffic summed across all road movements. A smaller PHF panel shares the same time axis
below the profile. Hour labels are visible below both panels, and each colored peak range is labelled
directly with its hours and total traffic; the chart has no separate legend. The Report.docx “Peak
hours” section contains a table with each exact start and end time plus vehicle and cyclist counts
and PHF. The hour is selected from the traffic shown by the daily profile, while participant quantities
are calculated independently of the selected report classification, directly from the base
AI classes in QuantityRaw. A dash marks a period without a complete positive hour; the report does
not calculate separate peaks for individual movements.
A separate hourly intensity chart places vehicles, pedestrians, and cyclists next to one another. This compares participant groups without tying their visibility to the classification selected for the sheet.
Below the table, the report adds movement cartograms for every formally detected hour: morning peak, midday peak, and afternoon peak. Each cartogram covers the exact hour shown in the table and uses the base AI classes independently of the selected report classification. When a period has no complete positive hour, its cartogram is not created. The full-measurement daily cartogram remains available in the results and in the general charts section.
The report places two donut charts one below the other. The category-structure chart presents every recorded vehicle category; the total vehicle count appears in the center, while the legend preserves classification order and shows each category's percentage, including shares below 1%. The movement-structure chart shows inbound movement shares directly on the donut and lists configured movement names with absolute vehicle counts in the legend. Category and movement colors match the same series in their corresponding hourly charts. Each donut is followed by a compact hourly chart showing how its structure changes through the day. Every non-empty bar has a height of 100% and represents category or movement shares, while the label above it gives the actual total traffic for that hour. This separates changes in traffic composition from changes in total volume.
Directly below the pair of category charts, the report lists the count and percentage share of every category in the active classification. Below the pair of movement charts, an equivalent list gives the measured road-user count and share for every road movement. These are counts from the selected measurement period, not ADT values.
Below the full traffic cartogram, the report adds a category-structure table by entrance. Rows use the same configured entrances as the entrance workbooks, while columns follow the active classification. Every value is the whole-measurement sum for road movements starting at that entrance; an entrance with no measured traffic remains visible with zero values. Wide tables use vertical compact category headers: a dotted label is shortened to the part before its first dot, while a label without a dot remains unchanged. Category order still follows the active classification.
An equivalent table appears directly below every generated peak cartogram. It covers only the exact
half-open hour [from, to) displayed in the peak table and cartogram caption, ensuring that its
entrance category structure represents precisely the same traffic as the corresponding cartogram.
Quantity sheet layouts
Currently supported layouts are:
Csv- flat CSV output.XlsxEntrances- oneQuantity.xlsxworkbook with one sheet per entrance.XlsxEntrancesHorizontal- oneQuantity.xlsxworkbook with one sheet per entrance and horizontal movement tables.XlsxEntrancesVertical- aQuantity.xlsxworkbook with vertically stacked GPR-standard tables for consecutive 15-minute intervals. Tables group movements by entrance and turn (Zaw,L,P,W), show pedestrians separately for each entrance, and append a summary table for the automatically selected peak hour (four consecutive intervals).XlsxTrafficUSA- aQuantity.xlsxworkbook with four compact tables: all vehicles, heavy vehicles, buses, and pedestrians. Vehicle columns are grouped by entrance and movement; pedestrian columns contain one total per entrance, without location metadata or peak-hour sections.
For intersection configurations that include pedestrian crossings, the XlsxEntrances and
XlsxEntrancesHorizontal layouts also append dedicated crossing sheets at the end of Quantity.xlsx
(one sheet per crossing).
The crossing sheet title uses a configurable prefix (for example translated in UI), followed by crossing id.
Output Types - Speed
Velocity.csv- A sheet with the history of each vehicle and the measured speed of movement.Velocity.xlsx- one worksheet per movement with time rows matching the report grouping period and columns representing speed ranges. Ranges have a width of 10 km/h or 5 mph. Each worksheet includes row and column totals, the share of vehicles in each speed range, and V50, V85, and V95 values.*.png- speed (scatter) and average speed charts,Report.docx- a fragment of the report is added regarding speed results, average speed depending on the "grouping category", limit violations, accuracy and correctness of counting.
Types of output data - ALPR
Alpr0to500.xlsx,Alpr500to1000.xlsx, ... - paginated sheets containing vehicle history, recognized plate text, and vehicle and plate images.*.png- graph of the accuracy of ALPR measurement and statistics of letter codes and countries,Report.docx- a fragment of the report concerning ALPR results, measurement accuracy, letter codes and countries is added,