Cartogram
Cartogram
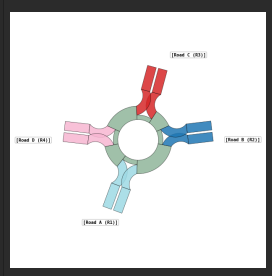
A cartogram visualizes traffic flow through an intersection. In reports, it displays the number of vehicles traveling between entry and exit points. On the Design page, only a cartogram template is shown.
When creating a cartogram, the system first uses configured roads to create nodes. If no roads are defined, gates are used instead. Each node has a unique name and is included in the report together with information about the number of vehicles traveling between connected nodes.
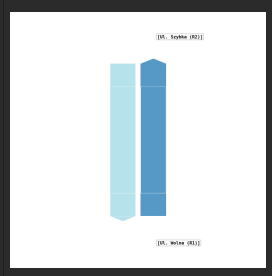
Several cartogram types are available. 1. 2 nodes.
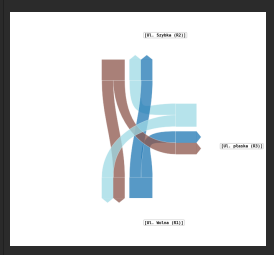
- 3 nodes.
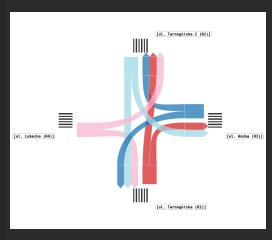
- 4 nodes.
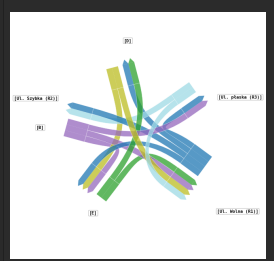
- more than 4 nodes.
- roundabout
Pedestrian Crossings on Cartograms
Pedestrian crossings can also be shown on a cartogram. To display a pedestrian crossing, connect it with a road in Design → Roads.
When a pedestrian crossing is connected to a road, the cartogram draws pedestrian crossing stripes on that road. This makes the pedestrian crossing visible in the report layout and helps show where pedestrian movement was measured in relation to the road network.
Use this when the report should show both vehicle movements and pedestrian crossing locations. If a pedestrian crossing is not connected to any road, it is still part of the scene configuration, but it will not be drawn as stripes on the cartogram road.