Traffic Counting Service
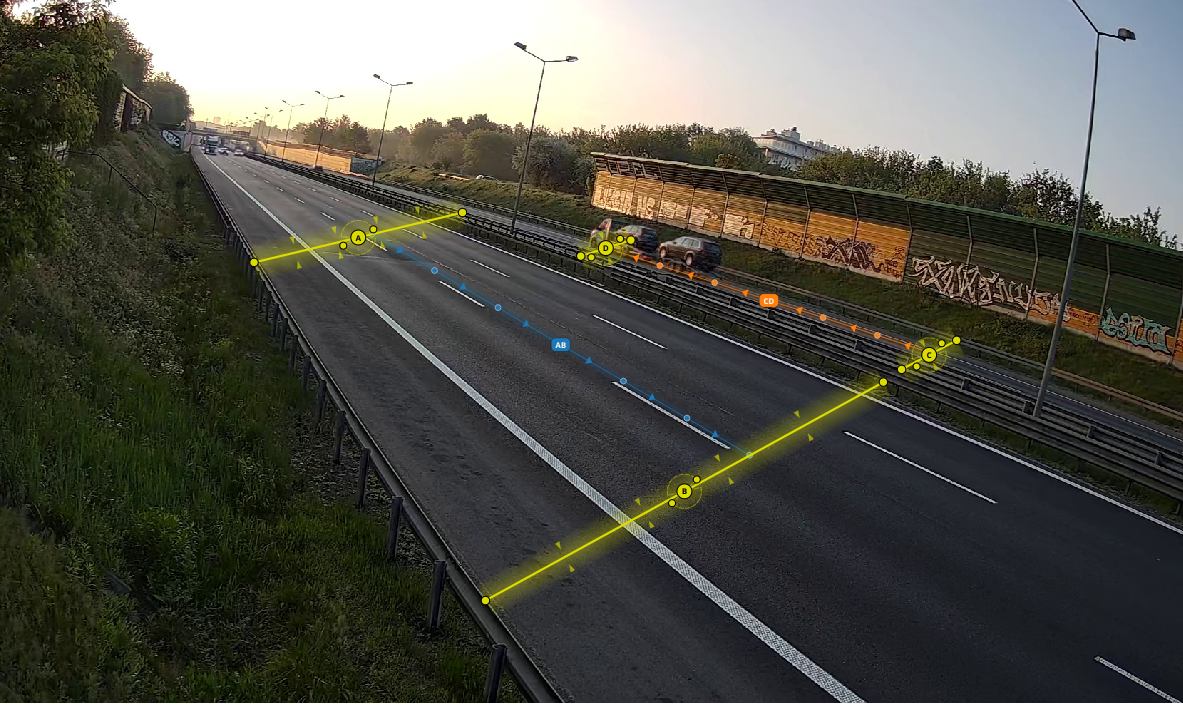
This service automatically counts and classifies both vehicles and pedestrians in video recordings. It counts every object that crosses a defined road cross-section or follows a configured movement.
Measurement accuracy
| Measurement type | Accuracy | Processing speed* |
|---|---|---|
| Road cross-section, vehicles | 97% | 5× |
| Intersection movement | 90% | 3× |
| Pedestrian movement | approximately 90% | 3× |
* A processing speed of 5× means that 24 hours of recording is processed in approximately five hours.
Use cases
- General Traffic Measurement (GPR) — official traffic surveys following Polish standards.
- Origin–destination studies — tracing traffic flows through complex intersections.
- Peak-hour analysis — identifying traffic patterns and congestion points.
- Urban planning — data for traffic modelling and infrastructure planning.
- Pedestrian-flow analysis — counting pedestrians in cities, at crossings, or in public spaces.
Generated reports and data
Output files
| File | Description |
|---|---|
Quantity.csv / Quantity.xlsx |
Standard result sheet containing object categories for each selected time interval |
History.csv |
Complete record of all tracked objects with timestamps |
Report.docx |
Measurement report generated in GPR format |
| Diagrams | Daily traffic profiles, category distributions, and cartograms |
Inference and Tracking Quality
When the processed configuration contains InferenceQuality.feather, the Quality mode in Results presents a measurement quality-check panel:
- Observation continuity (
tracked hits / tracker opportunities) as five-minute bars; - Frame coverage as a line over the same timeline; it is the share of cells overlapped by final tracked-object bounding boxes in the selected time range;
- recurring observation-gap outlines with an aggregate result, cell range, and compact movement shares;
- a default hotspot threshold below 50% continuity; frame-edge zones are hidden by default;
- a subtle cell grid that is always visible and needs no separate switch;
- a spatial observation-continuity map over the camera background;
The continuity map evaluates only locations with recorded tracker opportunities. A coloured cell describes continuity along observed tracks; an uncoloured cell with fewer than five observations remains neutral because there is not enough evidence to assess it. It does not identify objects that the system never detected.
The chart axis preserves real elapsed time, so gaps between recordings remain empty and multi-day measurements also show dates on the labels. Clicking an interval opens the corresponding recording position and changes the map to that interval; empty ranges cannot be selected. The subtle map grid is always visible. Older measurements without the Quality file remain supported and show an availability message.
Two summary values appear above the chart in user-facing language. Observation continuity describes how regularly objects remain observed along recorded trajectories; it is not a percentage of correctly counted vehicles. Frame coverage describes the image area occupied by final tracked-object bounding boxes in the active range. A low value alone does not prove that the camera is positioned incorrectly. Measurements produced with the earlier Quality format retain their historical point-based coverage and show a recalculation notice.
The observation map distinguishes continuous observation, frequent interruptions, and cells with insufficient data. A detected area receives one shared contour and a number matching the card beside the map. The same number appears in the cell tooltip. Its movement figures show how many trajectories cross the highlighted area; they do not by themselves prove a broken trajectory or a counting error. This hotspot analysis always summarizes the whole measurement, even while the map displays a selected five-minute interval.